Power BI Decomposition Tree Breaking Down Your Data
Use the Power BI Decomposition Tree Visual to explore your data and gain insights into how parts contribute to the whole. Drill into hierarchies to see how each part contributes to the total. Enable faster analysis for your team and gain data driven insights. Using this visual enables you to break down a metric by the dimensions of your data to see the impact of each. This can be used for root cause analysis such as failure of parts, operational processes or determining where you highest sales are coming from.
How to enable decomposition tree in Power BI
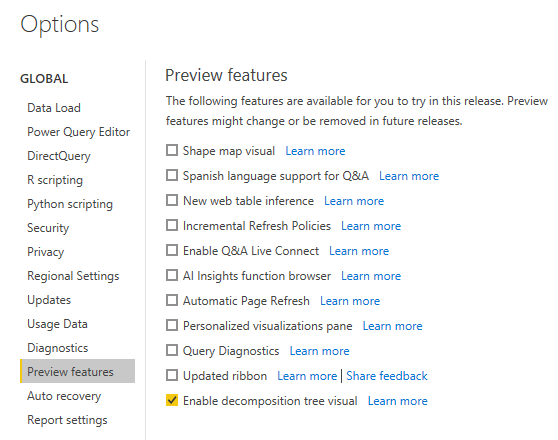
While in Preview mode, you will need to enable the feature in the Power BI options and then restart Power BI. First, Open Power BI Desktop and the select File > Options and Settings and then Options. This will open the Options window where you can enable many features in Power BI Desktop including Preview Features.
The screenshot below shows the proper setup for the power bi decomposition tree.
Analyzing Data with a Decomposition Tree
I am using a sample retail sales dataset to build out this decomposition tree Power BI example. The sample dataset can be found here – Retail Sales Dataset Download Page
First select the measure you want to explore such as Total Sales. Then add the columns that you would like to understand that lead to your sales.
In this example, I have retail sales by stores, products, payment type and gender. Using the decomposition tree allows me to analyze behaviors of customers with a single click.
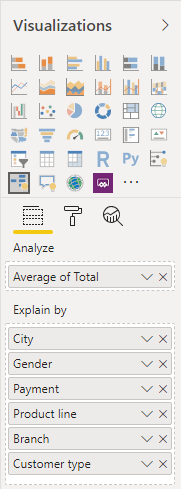
For example, I want to see the Payment methods and product lines that drives the highest average revenue for Female customers. I started by added the Total Sales to the Analyze section. Then added the City, Gender, Payment, Product line, Branch and Customer Type to the Explain By section of the Power BI decomposition tree visual.
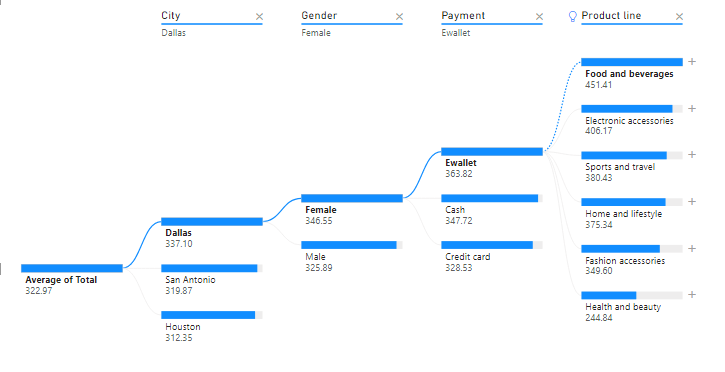
By clicking the plus sign at the end of each blue bar. I can then choose the next level of data to explore. In this case, I followed the path of City > Gender > Payment > Product line. I can now see that most female shoppers use an Ewallet and purchase food and beverages from the Dallas store.
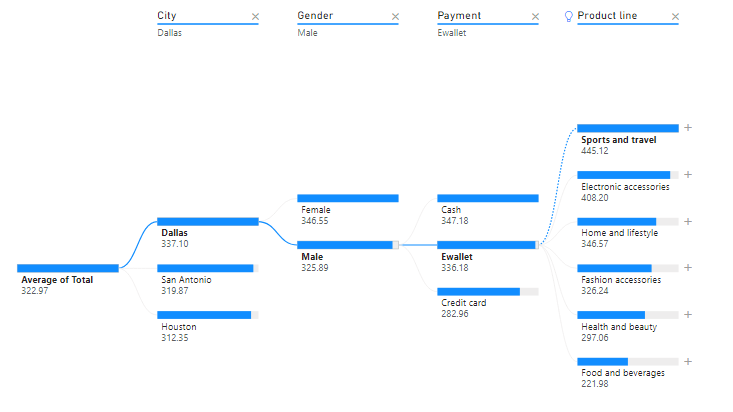
No to see what men are purchasing with EWallets. I can simply click on the blue bar on Male and then Ewallet to see that they are purchasing sports and travel items.
Please try using the Power BI Decomposition Tree and more value from your data. Email me with questions.
See it in action – Power BI Decomposition Tree Example – YouTube
CDO Advisors Microsoft Power BI Examples and Solutions:
BI as a Service – Low Monthly Fees, Pay Per Month Per User
Executive Dashboards – Get Dashboards in 4 Weeks
Healthcare Dashboard Proof of Concept – SEE your data visualized
Microsoft Power BI Demo – Compare your current reporting to Power BI
Power BI Quick Start Solutions – Ready to start or enhance your Power BI?
Train Your Team – Remote Power BI Developer and End User Training
Use Power BI for Finance Teams – Learn how Power BI can improve operations
Virtual Chief Data Officer – Confused by all your data? We can help
Need Power BI Training? – Get Power BI Training in Hours not Days
Looking for Power BI Consulting? – Power BI Quick Start
Get the CDO Advantage, Dashboards in 4 weeks!