[fusion_builder_container hundred_percent=”no” equal_height_columns=”no” menu_anchor=”” hide_on_mobile=”small-visibility,medium-visibility,large-visibility” class=”” id=”” background_color=”” background_image=”” background_position=”center center” background_repeat=”no-repeat” fade=”no” background_parallax=”none” parallax_speed=”0.3″ video_mp4=”” video_webm=”” video_ogv=”” video_url=”” video_aspect_ratio=”16:9″ video_loop=”yes” video_mute=”yes” overlay_color=”” video_preview_image=”” border_size=”” border_color=”” border_style=”solid” padding_top=”” padding_bottom=”” padding_left=”” padding_right=””][fusion_builder_row][fusion_builder_column type=”1_1″ layout=”1_1″ background_position=”left top” background_color=”” border_size=”” border_color=”” border_style=”solid” border_position=”all” spacing=”yes” background_image=”” background_repeat=”no-repeat” padding_top=”” padding_right=”” padding_bottom=”” padding_left=”” margin_top=”0px” margin_bottom=”0px” class=”” id=”” animation_type=”” animation_speed=”0.3″ animation_direction=”left” hide_on_mobile=”small-visibility,medium-visibility,large-visibility” center_content=”no” last=”no” min_height=”” hover_type=”none” link=””][fusion_text][vc_row][vc_column][vc_column_text][/fusion_text][/fusion_builder_column][/fusion_builder_row][/fusion_builder_container][fusion_builder_container hundred_percent=”no” hundred_percent_height=”no” hundred_percent_height_scroll=”no” hundred_percent_height_center_content=”yes” equal_height_columns=”no” menu_anchor=”” hide_on_mobile=”small-visibility,medium-visibility,large-visibility” status=”published” publish_date=”” class=”” id=”” background_color=”” background_image=”” background_position=”center center” background_repeat=”no-repeat” fade=”no” background_parallax=”none” enable_mobile=”no” parallax_speed=”0.3″ video_mp4=”” video_webm=”” video_ogv=”” video_url=”” video_aspect_ratio=”16:9″ video_loop=”yes” video_mute=”yes” video_preview_image=”” border_size=”” border_color=”” border_style=”solid” margin_top=”1%” margin_bottom=”1%” padding_top=”0px” padding_right=”0px” padding_bottom=”0px” padding_left=”0px”][fusion_builder_row][fusion_builder_column type=”1_1″ layout=”1_1″ spacing=”” center_content=”no” link=”” target=”_self” min_height=”” hide_on_mobile=”small-visibility,medium-visibility,large-visibility” class=”” id=”” background_image_id=”” background_color=”” background_image=”” background_position=”left top” undefined=”” background_repeat=”no-repeat” hover_type=”none” border_size=”0″ border_color=”” border_style=”solid” border_position=”all” padding_top=”0px” padding_right=”0px” padding_bottom=”0px” padding_left=”0px” margin_top=”0px” margin_bottom=”0px” animation_type=”” animation_direction=”left” animation_speed=”0.3″ animation_offset=”” last=”no”][fusion_title hide_on_mobile=”small-visibility,medium-visibility,large-visibility” class=”” id=”” content_align=”center” size=”2″ font_size=”” line_height=”” letter_spacing=”” margin_top=”” margin_bottom=”” text_color=”” style_type=”default” sep_color=””]
Use Power BI to Visualize Baltimore Crime Reports
[/fusion_title][/fusion_builder_column][/fusion_builder_row][/fusion_builder_container][fusion_builder_container hundred_percent=”no” hundred_percent_height=”no” hundred_percent_height_scroll=”no” hundred_percent_height_center_content=”yes” equal_height_columns=”no” menu_anchor=”” hide_on_mobile=”small-visibility,medium-visibility,large-visibility” status=”published” publish_date=”” class=”” id=”” background_color=”” background_image=”” background_position=”center center” background_repeat=”no-repeat” fade=”no” background_parallax=”none” enable_mobile=”no” parallax_speed=”0.3″ video_mp4=”” video_webm=”” video_ogv=”” video_url=”” video_aspect_ratio=”16:9″ video_loop=”yes” video_mute=”yes” video_preview_image=”” border_size=”” border_color=”” border_style=”solid” margin_top=”1%” margin_bottom=”1%” padding_top=”0px” padding_right=”0px” padding_bottom=”0px” padding_left=”0px”][fusion_builder_row][fusion_builder_column type=”1_3″ layout=”1_4″ spacing=”” center_content=”no” link=”” target=”_self” min_height=”” hide_on_mobile=”small-visibility,medium-visibility,large-visibility” class=”” id=”” background_color=”” background_image=”” background_image_id=”” background_position=”left top” background_repeat=”no-repeat” hover_type=”none” border_size=”0″ border_color=”” border_style=”solid” border_position=”all” padding_top=”” padding_right=”” padding_bottom=”” padding_left=”” margin_top=”” margin_bottom=”” animation_type=”” animation_direction=”left” animation_speed=”0.3″ animation_offset=”” last=”no”][fusion_text columns=”” column_min_width=”” column_spacing=”” rule_style=”default” rule_size=”” rule_color=”” hide_on_mobile=”small-visibility,medium-visibility,large-visibility” class=”” id=””]
Using Power BI to Visualize Baltimore Crime Reports
With Power BI you can take raw data and quickly transform it into easy to use visualizations. For this example, I will be using data from the Baltimore police crime reports public dataset that has data points back to 1963. However, most of the data really starts in 2014. I wanted to see what I could build from the dataset and spent a few hours pulling together the data and then building reports that enable me to see various trends about Baltimore crime reports.
[/fusion_text][/fusion_builder_column][fusion_builder_column type=”2_3″ layout=”2_3″ spacing=”” center_content=”yes” link=”” target=”_self” min_height=”” hide_on_mobile=”small-visibility,medium-visibility,large-visibility” class=”” id=”” background_image_id=”” background_color=”” background_image=”” background_position=”center center” undefined=”” background_repeat=”no-repeat” hover_type=”zoomin” border_size=”0″ border_color=”” border_style=”solid” border_position=”all” padding_top=”” padding_right=”” padding_bottom=”” padding_left=”” margin_top=”0px” margin_bottom=”0px” animation_type=”” animation_direction=”left” animation_speed=”0.3″ animation_offset=”” last=”no”][fusion_text columns=”1″ column_min_width=”” column_spacing=”” rule_style=”default” rule_size=”” rule_color=”” hide_on_mobile=”small-visibility,medium-visibility,large-visibility” class=”” id=””]
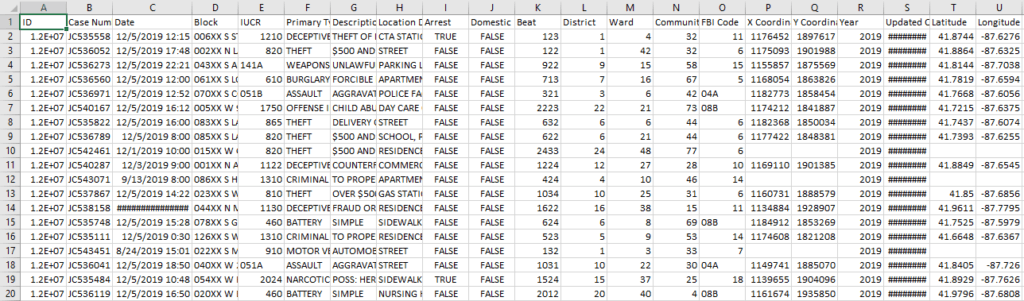
Here is a sample of the Baltimore Crime Reports available for download. As you can see it is difficult to spot trends and outliers in this format. If you are looking to visualize your crime report data, please contact us for assistance.
[/fusion_text][/fusion_builder_column][/fusion_builder_row][/fusion_builder_container][fusion_builder_container hundred_percent=”no” hundred_percent_height=”no” hundred_percent_height_scroll=”no” hundred_percent_height_center_content=”yes” equal_height_columns=”no” menu_anchor=”” hide_on_mobile=”small-visibility,medium-visibility,large-visibility” status=”published” publish_date=”” class=”” id=”” background_color=”” background_image=”” background_position=”center center” background_repeat=”no-repeat” fade=”no” background_parallax=”none” enable_mobile=”no” parallax_speed=”0.3″ video_mp4=”” video_webm=”” video_ogv=”” video_url=”” video_aspect_ratio=”16:9″ video_loop=”yes” video_mute=”yes” video_preview_image=”” border_size=”” border_color=”” border_style=”solid” margin_top=”1%” margin_bottom=”1%” padding_top=”0″ padding_right=”0″ padding_bottom=”0″ padding_left=”0″][fusion_builder_row][fusion_builder_column type=”2_3″ layout=”3_4″ spacing=”” center_content=”no” link=”” target=”_self” min_height=”” hide_on_mobile=”small-visibility,medium-visibility,large-visibility” class=”” id=”” background_color=”” background_image=”” background_image_id=”” background_position=”left top” background_repeat=”no-repeat” hover_type=”none” border_size=”0″ border_color=”” border_style=”solid” border_position=”all” padding_top=”” padding_right=”” padding_bottom=”” padding_left=”” margin_top=”” margin_bottom=”” animation_type=”” animation_direction=”left” animation_speed=”0.3″ animation_offset=”” last=”no”][fusion_text columns=”” column_min_width=”” column_spacing=”” rule_style=”default” rule_size=”” rule_color=”” hide_on_mobile=”small-visibility,medium-visibility,large-visibility” class=”” id=””]
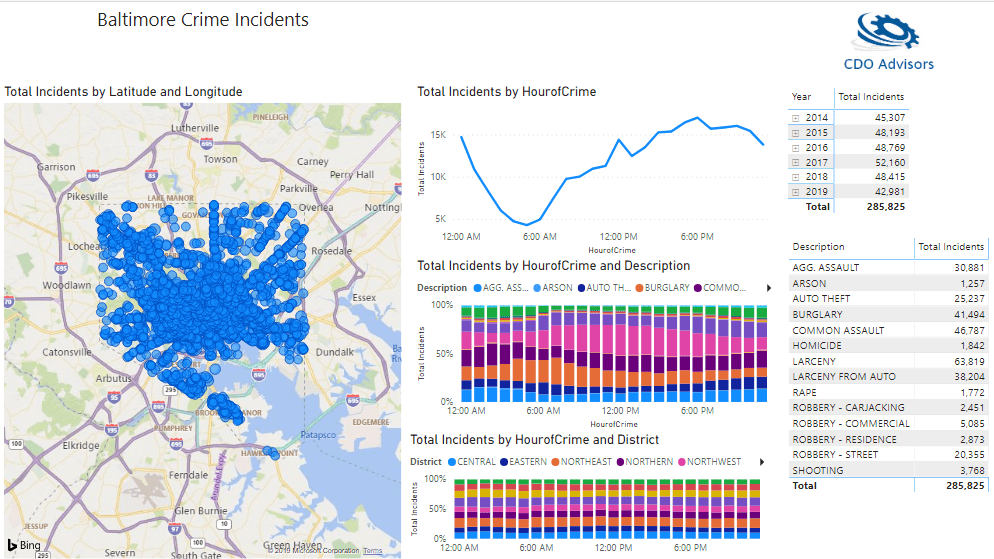
This report summarizes the crime reports by the time of day aggregated from data by year. The line graph shows that crime reports are lowest before 6AM and highest between 6PM and Midnight.
[/fusion_text][/fusion_builder_column][fusion_builder_column type=”1_3″ layout=”1_4″ spacing=”” center_content=”no” link=”” target=”_self” min_height=”” hide_on_mobile=”small-visibility,medium-visibility,large-visibility” class=”” id=”” background_color=”” background_image=”” background_image_id=”” background_position=”left top” background_repeat=”no-repeat” hover_type=”none” border_size=”0″ border_color=”” border_style=”solid” border_position=”all” padding_top=”” padding_right=”” padding_bottom=”” padding_left=”” margin_top=”” margin_bottom=”” animation_type=”” animation_direction=”left” animation_speed=”0.3″ animation_offset=”” last=”no”][fusion_text columns=”” column_min_width=”” column_spacing=”” rule_style=”default” rule_size=”” rule_color=”” hide_on_mobile=”small-visibility,medium-visibility,large-visibility” class=”” id=””]
Baltimore Crime Reports by Hour
For this page of my report. I wanted to see when crimes were occuring by the hour of the day. I converted the timestamps from the data into a column that provides me with the Hour of the Crime and then went to work building a report to show me exactly what happens and when.
I built a map that gives me the location of the reported crime and then some data grids that allow me to click to filter my results right on the report. For example, I can see crime reports by year or description of the crime just by clicking on the name in the data grids.
Then I added some visualizations to let me see trends over time. I have a line graph that shows how many crimes are reported by hour of day. From the data the 5 AM to 6 AM block is the lowest time for crime. While 6 PM to 7 PM has the most crimes reported.
I also wanted to see how incidents of crime trended by hour over the descriptions and districts. So I built 2 different 100% stacked bar charts to let me see trends into those data points. From the data Burglary is highest between 7 AM and 8AM and tapers off throughout the day.
[/fusion_text][/fusion_builder_column][/fusion_builder_row][/fusion_builder_container][fusion_builder_container hundred_percent=”no” hundred_percent_height=”no” hundred_percent_height_scroll=”no” hundred_percent_height_center_content=”yes” equal_height_columns=”no” menu_anchor=”” hide_on_mobile=”small-visibility,medium-visibility,large-visibility” status=”published” publish_date=”” class=”” id=”” background_color=”” background_image=”” background_position=”center center” background_repeat=”no-repeat” fade=”no” background_parallax=”none” enable_mobile=”no” parallax_speed=”0.3″ video_mp4=”” video_webm=”” video_ogv=”” video_url=”” video_aspect_ratio=”16:9″ video_loop=”yes” video_mute=”yes” video_preview_image=”” border_size=”” border_color=”” border_style=”solid” margin_top=”1%” margin_bottom=”1%” padding_top=”0px” padding_right=”0px” padding_bottom=”0px” padding_left=”0px”][fusion_builder_row][fusion_builder_column type=”1_4″ layout=”1_4″ spacing=”” center_content=”no” link=”” target=”_self” min_height=”” hide_on_mobile=”small-visibility,medium-visibility,large-visibility” class=”” id=”” background_color=”” background_image=”” background_image_id=”” background_position=”left top” background_repeat=”no-repeat” hover_type=”none” border_size=”0″ border_color=”” border_style=”solid” border_position=”all” padding_top=”” padding_right=”” padding_bottom=”” padding_left=”” margin_top=”” margin_bottom=”” animation_type=”” animation_direction=”left” animation_speed=”0.3″ animation_offset=”” last=”no”][fusion_text columns=”” column_min_width=”” column_spacing=”” rule_style=”default” rule_size=”” rule_color=”” hide_on_mobile=”small-visibility,medium-visibility,large-visibility” class=”” id=””]
Baltimore Crime Reports by Year
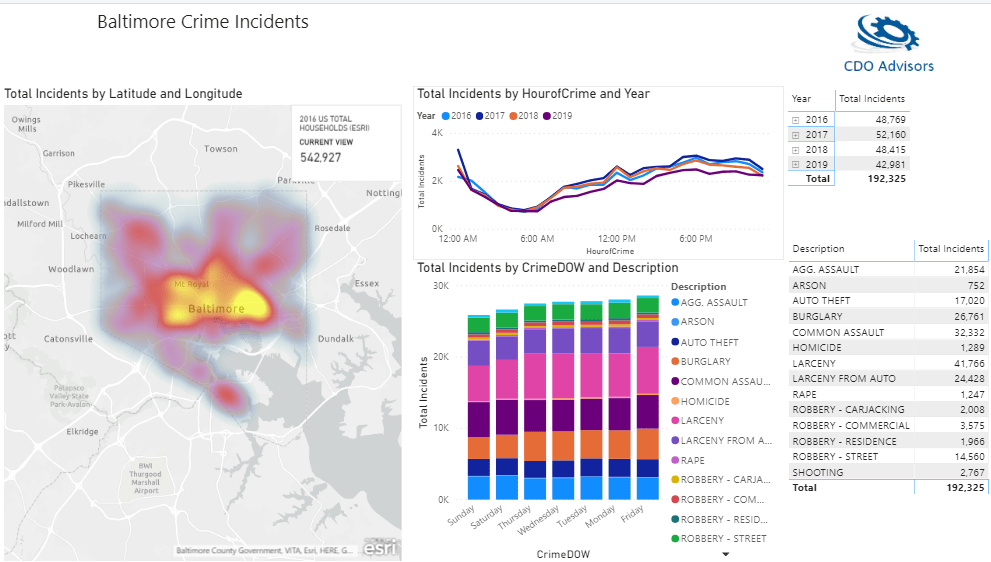
For the next page in my report. I wanted to look at the data trends over time, in this case years. Are the trends uniform or are their spikes in crime reports in different years.
[/fusion_text][/fusion_builder_column][fusion_builder_column type=”3_4″ layout=”3_4″ spacing=”” center_content=”yes” link=”” target=”_self” min_height=”” hide_on_mobile=”small-visibility,medium-visibility,large-visibility” class=”” id=”” background_image_id=”” background_color=”” background_image=”” background_position=”center center” undefined=”” background_repeat=”no-repeat” hover_type=”zoomin” border_size=”0″ border_color=”” border_style=”solid” border_position=”all” padding_top=”” padding_right=”” padding_bottom=”” padding_left=”” margin_top=”” margin_bottom=”” animation_type=”” animation_direction=”left” animation_speed=”0.3″ animation_offset=”” last=”no”][fusion_text columns=”” column_min_width=”” column_spacing=”” rule_style=”default” rule_size=”” rule_color=”” hide_on_mobile=”small-visibility,medium-visibility,large-visibility” class=”” id=””]
Visualization of crime reports by day of week and hour of day from 2016 to 2019.
[/fusion_text][/fusion_builder_column][/fusion_builder_row][/fusion_builder_container][fusion_builder_container hundred_percent=”no” hundred_percent_height=”no” hundred_percent_height_scroll=”no” hundred_percent_height_center_content=”yes” equal_height_columns=”no” menu_anchor=”” hide_on_mobile=”small-visibility,medium-visibility,large-visibility” status=”published” publish_date=”” class=”” id=”” background_color=”” background_image=”” background_position=”center center” background_repeat=”no-repeat” fade=”no” background_parallax=”none” enable_mobile=”no” parallax_speed=”0.3″ video_mp4=”” video_webm=”” video_ogv=”” video_url=”” video_aspect_ratio=”16:9″ video_loop=”yes” video_mute=”yes” video_preview_image=”” border_size=”” border_color=”” border_style=”solid” margin_top=”1%” margin_bottom=”1%” padding_top=”0″ padding_right=”0″ padding_bottom=”0″ padding_left=”0″][fusion_builder_row][fusion_builder_column type=”2_3″ layout=”3_4″ spacing=”” center_content=”no” link=”” target=”_self” min_height=”” hide_on_mobile=”small-visibility,medium-visibility,large-visibility” class=”” id=”” background_color=”” background_image=”” background_image_id=”” background_position=”left top” background_repeat=”no-repeat” hover_type=”none” border_size=”0″ border_color=”” border_style=”solid” border_position=”all” padding_top=”” padding_right=”” padding_bottom=”” padding_left=”” margin_top=”” margin_bottom=”” animation_type=”” animation_direction=”left” animation_speed=”0.3″ animation_offset=”” last=”no”][fusion_text columns=”” column_min_width=”” column_spacing=”” rule_style=”default” rule_size=”” rule_color=”” hide_on_mobile=”small-visibility,medium-visibility,large-visibility” class=”” id=””]
Having data means having dirty data. This page in my report shows crime reports that do not have a District assigned. There are 97 occurrences of crime reports that do not have a proper district.
[/fusion_text][/fusion_builder_column][fusion_builder_column type=”1_3″ layout=”1_4″ spacing=”” center_content=”no” link=”” target=”_self” min_height=”” hide_on_mobile=”small-visibility,medium-visibility,large-visibility” class=”” id=”” background_color=”” background_image=”” background_image_id=”” background_position=”left top” background_repeat=”no-repeat” hover_type=”none” border_size=”0″ border_color=”” border_style=”solid” border_position=”all” padding_top=”” padding_right=”” padding_bottom=”” padding_left=”” margin_top=”” margin_bottom=”” animation_type=”” animation_direction=”left” animation_speed=”0.3″ animation_offset=”” last=”no”][fusion_text columns=”” column_min_width=”” column_spacing=”” rule_style=”default” rule_size=”” rule_color=”” hide_on_mobile=”small-visibility,medium-visibility,large-visibility” class=”” id=””]
Data Quality in Crime Reports
To quickly spot any data issues, I created a page that highlights crime reports that do not have a District assigned. This allows me to spot data quality issues in the data. The most common day to have no District assigned in Sunday as shown on the bar graph in the middle. While Larceny from Auto is the most common description to have data quality issues. From this view a Data Steward could identify the crime reports that have data issues. Then correct the data in the source system and clean up the data incrementally.
[/fusion_text][/fusion_builder_column][/fusion_builder_row][/fusion_builder_container][fusion_builder_container hundred_percent=”no” hundred_percent_height=”no” hundred_percent_height_scroll=”no” hundred_percent_height_center_content=”yes” equal_height_columns=”no” menu_anchor=”” hide_on_mobile=”small-visibility,medium-visibility,large-visibility” status=”published” publish_date=”” class=”” id=”” background_color=”” background_image=”” background_position=”center center” background_repeat=”no-repeat” fade=”no” background_parallax=”none” enable_mobile=”no” parallax_speed=”0.3″ video_mp4=”” video_webm=”” video_ogv=”” video_url=”” video_aspect_ratio=”16:9″ video_loop=”yes” video_mute=”yes” video_preview_image=”” border_size=”” border_color=”” border_style=”solid” margin_top=”1%” margin_bottom=”1%” padding_top=”0px” padding_right=”0px” padding_bottom=”0px” padding_left=”0px”][fusion_builder_row][fusion_builder_column type=”1_4″ layout=”1_4″ spacing=”” center_content=”no” link=”” target=”_self” min_height=”” hide_on_mobile=”small-visibility,medium-visibility,large-visibility” class=”” id=”” background_color=”” background_image=”” background_image_id=”” background_position=”left top” background_repeat=”no-repeat” hover_type=”none” border_size=”0″ border_color=”” border_style=”solid” border_position=”all” padding_top=”” padding_right=”” padding_bottom=”” padding_left=”” margin_top=”” margin_bottom=”” animation_type=”” animation_direction=”left” animation_speed=”0.3″ animation_offset=”” last=”no”][fusion_text columns=”” column_min_width=”” column_spacing=”” rule_style=”default” rule_size=”” rule_color=”” hide_on_mobile=”small-visibility,medium-visibility,large-visibility” class=”” id=””]
Key Influencers
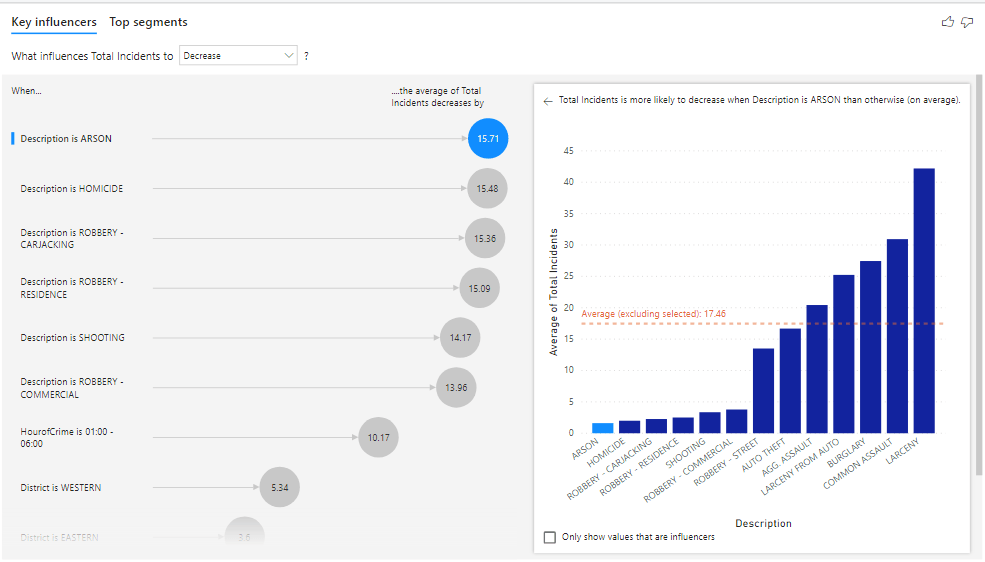
Power BI has the ability to run the data through machine learning to look for key influencers in data. In this example, I wanted to know what description of crimes lead to a decrease in the total incidents. The top 3 descriptions are Arson, Homicide and Robbery – Carjacking. Meaning that these 3 types of crimes are lower than other in total reported cases. This feature automatically changes based upon the different values you may want to investigate. Allowing for highly interactive data analytics and machine learning on this or any dataset.
[/fusion_text][/fusion_builder_column][fusion_builder_column type=”3_4″ layout=”3_4″ spacing=”” center_content=”yes” link=”” target=”_self” min_height=”” hide_on_mobile=”small-visibility,medium-visibility,large-visibility” class=”” id=”” background_image_id=”” background_color=”” background_image=”” background_position=”center center” undefined=”” background_repeat=”no-repeat” hover_type=”zoomin” border_size=”0″ border_color=”” border_style=”solid” border_position=”all” padding_top=”” padding_right=”” padding_bottom=”” padding_left=”” margin_top=”” margin_bottom=”” animation_type=”” animation_direction=”left” animation_speed=”0.3″ animation_offset=”” last=”no”][fusion_text columns=”” column_min_width=”” column_spacing=”” rule_style=”default” rule_size=”” rule_color=”” hide_on_mobile=”small-visibility,medium-visibility,large-visibility” class=”” id=””]
Machine Learning on Crime Reports by Description of Crime
[/fusion_text][/fusion_builder_column][/fusion_builder_row][/fusion_builder_container][fusion_builder_container hundred_percent=”no” hundred_percent_height=”no” hundred_percent_height_scroll=”no” hundred_percent_height_center_content=”yes” equal_height_columns=”no” menu_anchor=”” hide_on_mobile=”small-visibility,medium-visibility,large-visibility” status=”published” publish_date=”” class=”” id=”” background_color=”” background_image=”” background_position=”center center” background_repeat=”no-repeat” fade=”no” background_parallax=”none” enable_mobile=”no” parallax_speed=”0.3″ video_mp4=”” video_webm=”” video_ogv=”” video_url=”” video_aspect_ratio=”16:9″ video_loop=”yes” video_mute=”yes” video_preview_image=”” border_size=”” border_color=”” border_style=”solid” margin_top=”” margin_bottom=”” padding_top=”” padding_right=”” padding_bottom=”” padding_left=””][fusion_builder_row][fusion_builder_column type=”1_1″ layout=”1_1″ spacing=”” center_content=”no” link=”” target=”_self” min_height=”” hide_on_mobile=”small-visibility,medium-visibility,large-visibility” class=”” id=”” background_color=”” background_image=”” background_image_id=”” background_position=”left top” background_repeat=”no-repeat” hover_type=”none” border_size=”0″ border_color=”” border_style=”solid” border_position=”all” padding_top=”” padding_right=”” padding_bottom=”” padding_left=”” margin_top=”” margin_bottom=”” animation_type=”” animation_direction=”left” animation_speed=”0.3″ animation_offset=”” last=”no”][fusion_code]PGRpdiBjbGFzcz0iX2Zvcm1fMTEiPjwvZGl2PjxzY3JpcHQgc3JjPSJodHRwczovL2Nkb2Fkdmlzb3JzLmFjdGl2ZWhvc3RlZC5jb20vZi9lbWJlZC5waHA/aWQ9MTEiIHR5cGU9InRleHQvamF2YXNjcmlwdCIgY2hhcnNldD0idXRmLTgiPjwvc2NyaXB0Pg==[/fusion_code][/fusion_builder_column][/fusion_builder_row][/fusion_builder_container][fusion_builder_container hundred_percent=”no” equal_height_columns=”no” menu_anchor=”” hide_on_mobile=”small-visibility,medium-visibility,large-visibility” class=”” id=”” background_color=”” background_image=”” background_position=”center center” background_repeat=”no-repeat” fade=”no” background_parallax=”none” parallax_speed=”0.3″ video_mp4=”” video_webm=”” video_ogv=”” video_url=”” video_aspect_ratio=”16:9″ video_loop=”yes” video_mute=”yes” overlay_color=”” video_preview_image=”” border_size=”” border_color=”” border_style=”solid” padding_top=”” padding_bottom=”” padding_left=”” padding_right=””][fusion_builder_row][fusion_builder_column type=”1_1″ layout=”1_1″ background_position=”left top” background_color=”” border_size=”” border_color=”” border_style=”solid” border_position=”all” spacing=”yes” background_image=”” background_repeat=”no-repeat” padding_top=”” padding_right=”” padding_bottom=”” padding_left=”” margin_top=”0px” margin_bottom=”0px” class=”” id=”” animation_type=”” animation_speed=”0.3″ animation_direction=”left” hide_on_mobile=”small-visibility,medium-visibility,large-visibility” center_content=”no” last=”no” min_height=”” hover_type=”none” link=””][fusion_text][/vc_column_text][vc_video link=”https://youtu.be/McAKgS1kLjU” align=”center” title=”Use Power BI to Visualize Crime Report Video”][/vc_column][/vc_row][/fusion_text][fusion_separator style_type=”default” hide_on_mobile=”small-visibility,medium-visibility,large-visibility” class=”” id=”” sep_color=”” top_margin=”” bottom_margin=”” border_size=”” icon=”” icon_circle=”” icon_circle_color=”” width=”” alignment=”center” /][fusion_text columns=”” column_min_width=”” column_spacing=”” rule_style=”default” rule_size=”” rule_color=”” hide_on_mobile=”small-visibility,medium-visibility,large-visibility” class=”” id=””]
CDO Advisors Microsoft Power BI Solutions:
BI as a Service – Low Monthly Fees, Pay Per Month Per User
Executive Dashboards – Get Dashboards in 4 Weeks
Healthcare Dashboard Proof of Concept – SEE your data visualized
Microsoft Power BI Demo – Compare your current reporting to Power BI
Power BI Quick Start Solutions – Ready to start or enhance your Power BI?
Train Your Team – Remote Power BI Developer and End User Training
Use Power BI for Finance Teams – Learn how Power BI can improve operations
Virtual Chief Data Officer – Confused by all your data? We can help
[/fusion_text][/fusion_builder_column][/fusion_builder_row][/fusion_builder_container]